 COINNEWS
ETH Growth Outpaces BTC, but Market Liquidity Declines
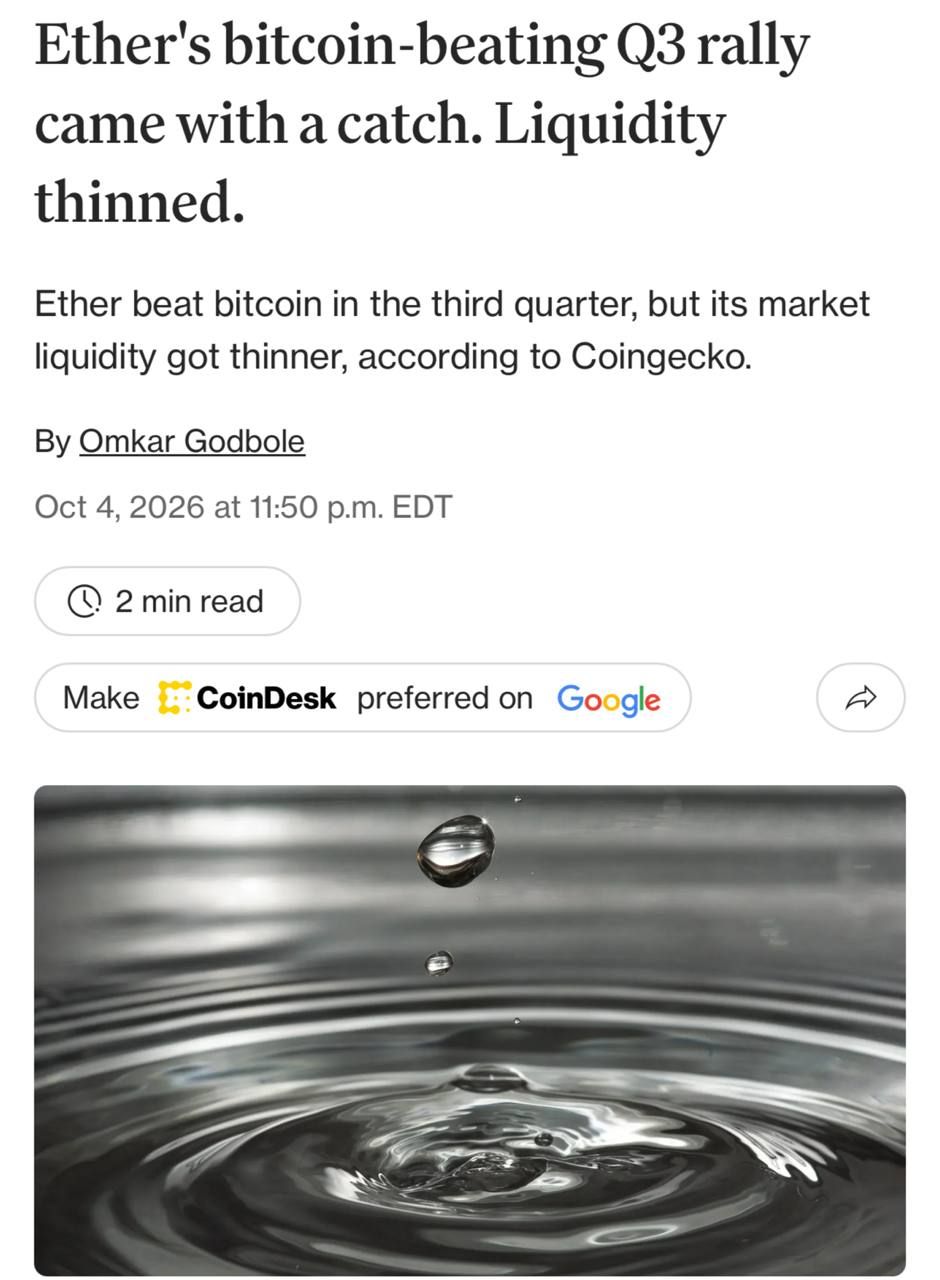
Ethereum showed significant price growth in the third quarter, outpacing Bitcoin in dynamics. However, analysis of market data revealed a critical decline in asset liquidity.
Price Dynamics and Market Depth
In the third quarter, ETH's cost rose by 70%, while BTC increased by 42%. Despite such a gap in yield, market depth has not kept up with price movements.
According to CoinGecko, from July 6 to September 30, the median daily depth of ETH was only 35-45% of Bitcoin's indicator. A year ago, this indicator was no lower than 60%.
Within 0.15% of the market price, the volume of orders for ETH was estimated at $13-14 million. Low liquidity means that large trades can significantly shift the price, increasing slippage.
Comparative Analysis of Liquidity of Other Assets
On most exchanges, more than $1 million in orders remained on each side of the book for ETH. For comparison, Solana's depth decreased from approximately $28 million to $20 million on each side of the book within 2% of the price.
The XRP market shows the following picture:
- Buy orders amounted to about $18 million
- Sell orders reached $14 million
- SOL's average daily turnover exceeds XRP's by 25%
The data provided confirm that the growth of digital assets' quotes alone does not guarantee an automatic increase in liquidity on trading platforms.